Financial Markets
Exchanges and brokerages from first principles
The global financial system exists to price, transfer, and distribute risk. Every asset (stocks, bonds, derivatives, etc.) encodes a unique risk profile and payoff function, allowing market participants to express viewpoints.
A market is a place where people can go to trade various assets. In finance terms, markets are where buyers and sellers meet to trade assets at prices they both accept. Functioning markets match people who want something with people who have it and determine what price clears the market. Today, almost all financial assets are traded electronically.
Modern financial markets facilitate the trading of assets through order books. Order books are digital ledgers that track all pending buy and sell orders based on price-time priority. Price-time priority dictates that trades are matched based on the best available price, and if multiple orders have the same price, the earliest order by time takes priority.
Order books have bids and asks. Buy orders (bids) stack up on one side, ordered from highest to lowest price. Sell orders (asks) line up on the other, from lowest to highest. When a bid meets or exceeds an ask, the matching engine executes a trade automatically. This process repeats millions of times per day, constantly discovering the price where supply meets demand.
In the US, the market infrastructure is split into two key players: exchanges and brokerages.
Exchanges are venues that define market structure rules to facilitate the buying and selling of an asset. Trades typically occur on an order book on a server. Notable exchanges include NYSE, Nasdaq, and ICE.
Brokerages are entities that connect users to exchanges. Users submit trades to brokerages who execute trades on your behalf through exchanges.
The separation between exchanges (execution venues) and brokerages (order-originators) was the direct effect of the Securities Exchange Act of 1934. Some countries implement a similar bifurcation (Canada, United Kingdom, Australia), while others operate exchanges and brokerages as a unified entity (China, Hong Kong, Singapore).
The vast majority of crypto exchanges operate both the exchange and the brokerage, including prediction market venues such as Polymarket and Kalshi.
This post explores the primary revenue sources of exchanges and brokerages.
Exchanges
There are two primary revenue streams for exchanges:
- Data services
- Trading fees
Data Services
Exchanges sell data to interested parties willing to pay for it. This includes market makers, investment banks, data vendors, and hedge funds.
These data services include ultra low-latency price feeds, full order book depth, hidden order information, and other granular exchange data.
In 2024, ICE and Nasdaq generated over $5B in revenue from data services (price feeds, analytics, etc.) combined.
Trading Fees
Exchanges also make money by charging fees on every trade. Trades on a typical exchange occur on an orderbook and are either:
- Maker orders that provide liquidity (limit orders)
- Taker orders (market orders)
Makers
Providing liquidity is a service that costs money. Market makers must pay engineers and quants, manage custom infrastructure pipelines, manage risk, and deploy millions in capital.
If you charge makers high fees, this cuts into the margins and business viability of market makers providing liquidity on your exchange. High fees lead to market makers quoting wider (increasing the bid-ask spread). Takers receive worse prices, so no users will want to trade on your exchange. Fees on market makers are a tax on liquidity and they go straight to spreads.
Many exchanges offer makers negative fees, also known as maker rebates. This means that makers receive money for providing liquidity.
Takers
Taker orders are typically classified as non-toxic or toxic. Whether or not a trade is non-toxic or toxic is highly correlated to the entity initiating the trade.
Non-toxic traders are typically retail users who want to buy an asset and don’t have more information than the market maker.
Toxic traders are entities who participate in trades and specifically aim to pick off mispriced quotes from market makers. Market makers spend almost all of their time trying to minimize the number of times they are providing liquidity on the wrong end of a trade.
Charge takers too much and users will go to other venues with lower fees. Without non-toxic flow, the exchange will die.
Design Space
Exchanges have implemented different design decisions to facilitate equities trading:
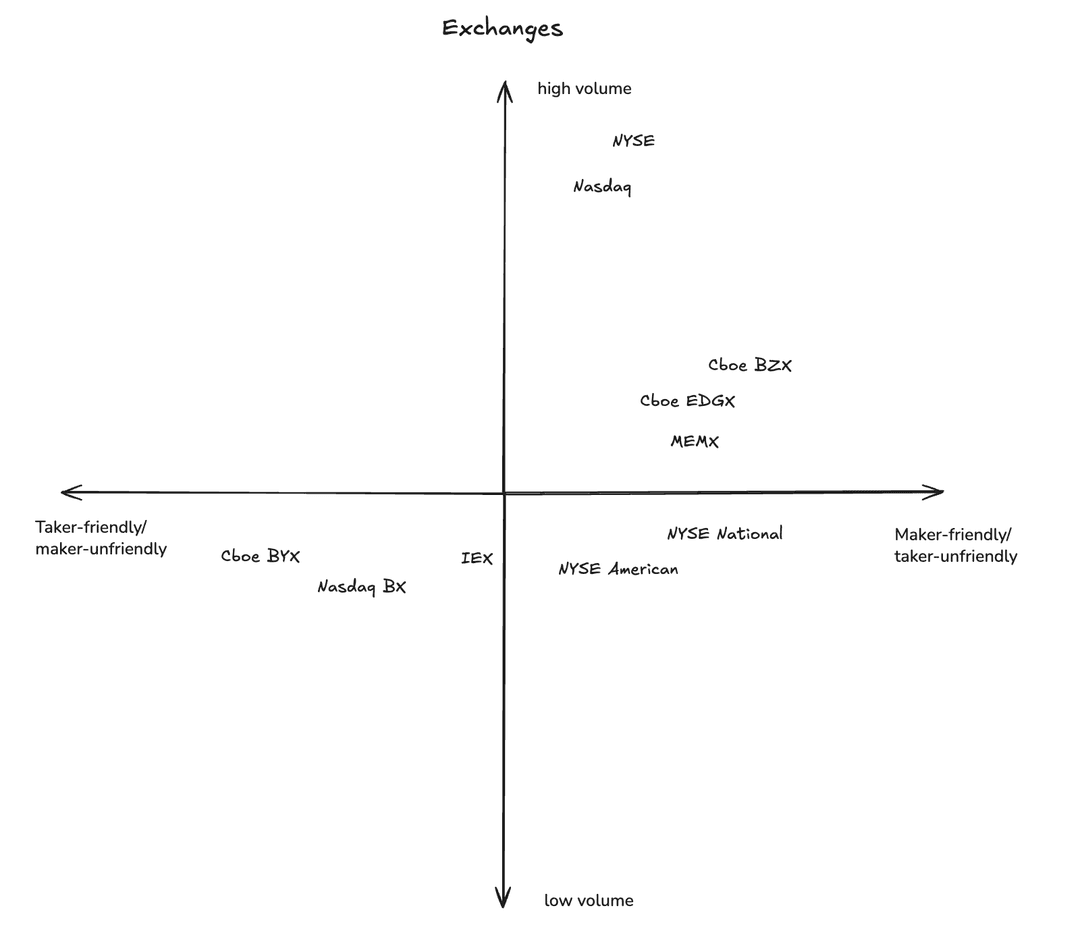
Nasdaq offers the strongest liquidity and tightest spreads, with maker rebates of -0.20 to -0.32 bps and a 0.25 to 0.30 bps taker fee.
NYSE follows closely with a maker rebate of -0.15 to -0.30 bps and a taker fee of 0.25 to 0.45 bps.
Nasdaq BX operates under an inverted taker-maker fee model, where takers receive rebates of -0.15 to 0.40 bps and makers pay 0.16 to 0.2 bps. Because of this, spreads on the Nasdaq BX are much wider and less liquidity is available on the order book.
Brokerages
Brokerages connect users to exchanges. They operate as a router that seeks to execute the user’s order at the best price.
There are robust laws and oversight that require brokerages to seek the best price across all available exchanges. This ensures that users receive the best available price, protecting against any collusion or side deals between brokerages and exchanges.
There are two primary revenue streams for brokerages:
- Interest and lending income
- Trade execution
Interest and Lending Income
Brokerages generate revenue on idle assets:
- Net interest margin: Brokerages earn interest on uninvested customer cash balances while paying little to no interest to customers. They lend it out to US treasuries, money markets, and repo markets. With billions in customer assets under management, a 2-3% spread generates substantial revenue.
- Securities lending: Customer shares are lent to short sellers for a fee. Brokerages typically keep most or all of this revenue.
- Margin loans: Brokerages lend money to customers to buy securities at a rate of 7-12% annually.
Trade Execution
Some brokerages explicitly charge trading fees to users. Trading equities has become extremely competitive and commoditized so many brokerages charge no fees for stock trades. Many brokerages charge fees for derivative instruments such as options (~$0.65 per contract).
Brokerages can also sell user order flow to market makers, outsourcing execution. Instead of brokers routing orders to exchange with the best price, they sell the right to fill the order to a market maker known as payment for order flow (PFOF). Market makers pay for this right because they know that their counterparty is non-toxic.
PFOF works when you can segment traders and share part of a wide spread.
If a stock is trading at a $100 / $101 bid-ask, the $1 covers the market makers’ risk of being picked off by informed traders. Market makers make money when uninformed (non-toxic) traders buy at $101 and lose money when informed (toxic) traders buy before a news event that re-prices the stock to $102.
If you can segment the non-toxic and toxic flow, you can offer a better price to non-toxic traders ($100.80 instead of $101) while still earning a profit. The leftover margin can be shared between the broker and the market maker.
In reality, most stocks already have very tight bid-ask spreads. This means that there is very little economic space to pay for order flow. Robinhood’s filings show that PFOF from equities accounts for only 6% of its total revenue. Options, on the other hand, have much higher spreads, which is why PFOF from options accounts for 26% of Robinhood’s revenue.
Design Space
Brokerages offer a distinct user experience to best serve their specific user base:
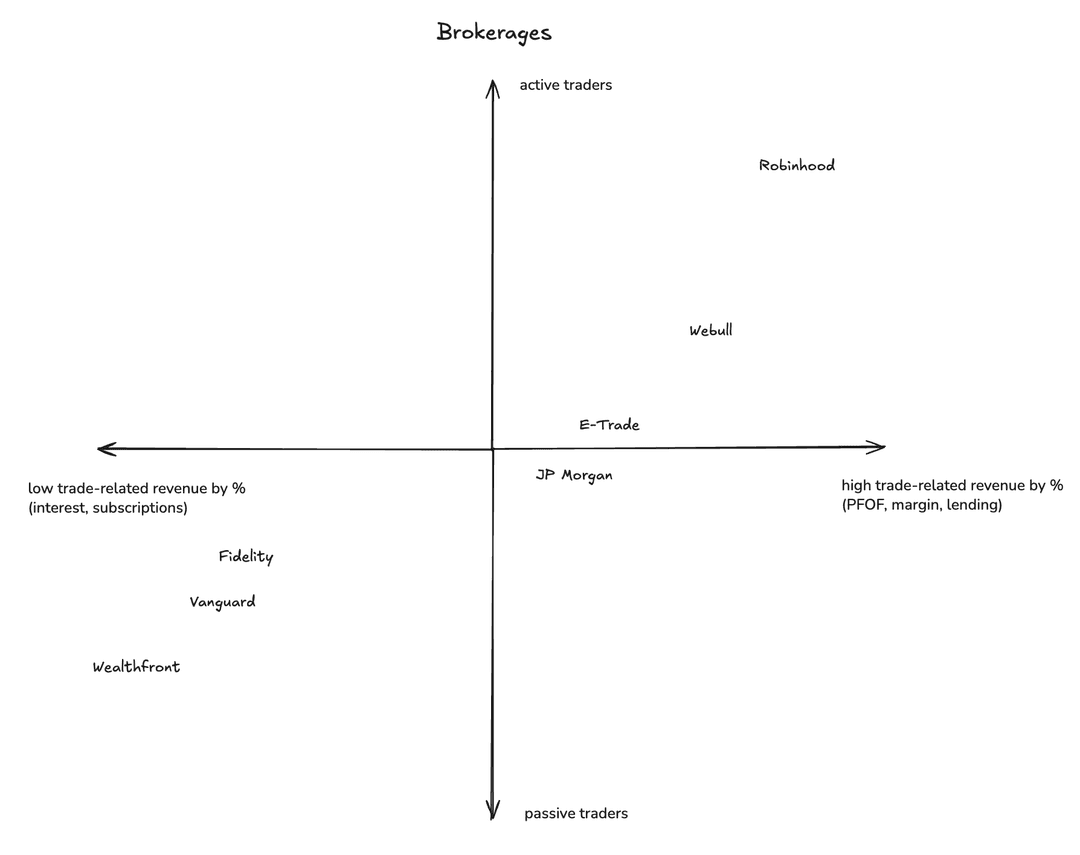
Based on aggregate average revenue per user, Fidelity and E-Trade dominate due to their large AUM and respective interest income generated from idle assets.
If we were to instead ask, “For every $1 a customer keeps with this platform, how many cents does the brokerage earn?” Robinhood and Webull generate $0.015 - $0.025 per dollar deposited on the brokerage.
This translates to Robinhood and Webull generating 10-30x the amount of revenue per AUM dollar than Vanguard.